Underground Cable Installation Solution Story
When it comes to underground cable installations, there are many known factors. However, there is one critical unknown fact...
There are many known factors when planning an underground cable installation project. Generally, the site plan, conduit design, number and radii of bends, and the overall length of the pull are known or predetermined. The type of cable to be installed, its weight, diameter, and jacket material are also known and taken into account. However, there is one critical yet unknown variable at the core of every cable installation. Project managers, planning engineers, and cable installers must have a reasonable estimate of the coefficient of friction (COF) to properly plan a pull’s feasibility and stay within cable tension limits. This begs the question: “What should the COF be for any particular cable installation?”
In one example, a contractor needed to pull an MDPE-jacketed cable with a 5.2-inch (132 mm) OD through an 8-inch (200mm) PVC conduit over a total length of 1,649 feet (503 m). The total cable weight was 35,000 lbs. (15876 kg). The pull was up a 3° grade for 1,020 feet (311 m), through a 45° bend with 100-foot (30 m) radius, and then downhill 4° for the final 550 feet (152 m).
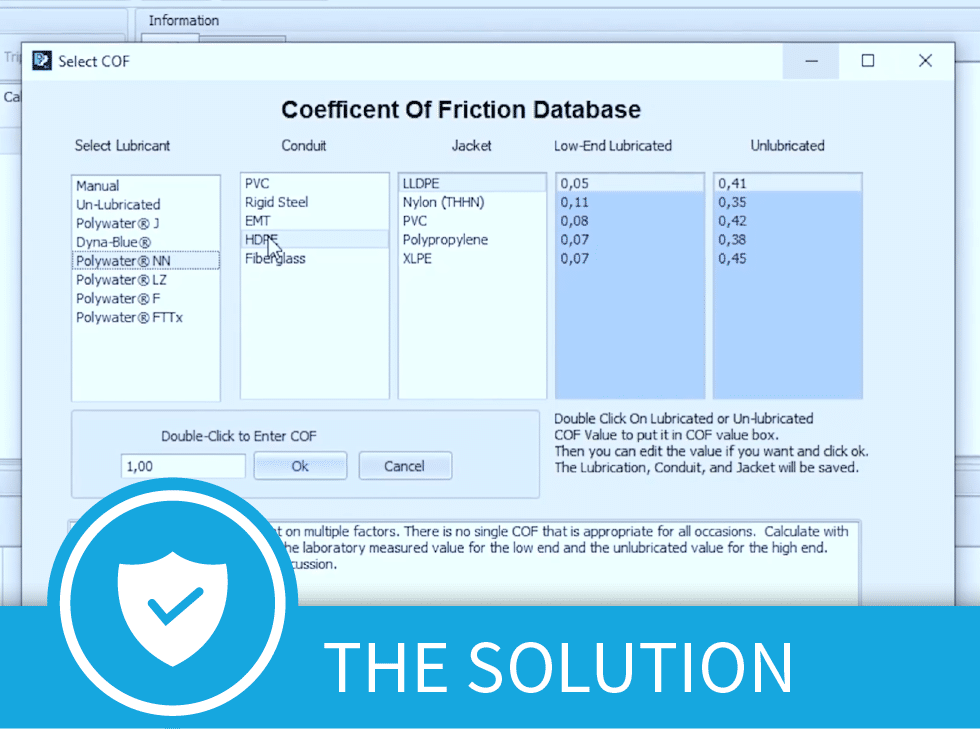
Polywater has friction-tested thousands of cables, conduit, and lubricant combinations over decades. The results are compiled in a vast COF database available in the Pull-Planner™ software. The contractor utilized this data to make an informed decision.
Cable manufacturers provide maximum tension and sidewall pressure limits and may recommend a conservative benchmark COF of 0.35 or higher to ensure safe cable handling during installation. However, companies can often reduce this number by 50% to 65% using a performance lubricant. The ability to safely reduce COF is accomplished via proper pulling practices and optimal lubricant choice.
The program allowed the contractor to input the cable, conduit, and plan design specifics for the installation. After selecting a lubricant type, the software recommended a COF and checked for feasibility. The software showed how different cable and lubricant combinations contribute to lower tension, helping optimize the project.
The program calculates expected tensions and provides insights that allow for longer cable installations. Actual field-measured tension recorded with a tensiometer, or dynamometer can be entered, allowing the Pull-Planner to back-calculate a true field COF to better predict tension in subsequent pulls.

The software allowed the contractor to predict how the combination of different materials and the optimal lubricant would contribute to lower tension during the installation. Using a COF of 0.14, the estimated ending tension was 5,157 lbf (22.9 kN). The actual ending tension as measured with a dynamometer was 4,100 lbf (18.2 kN), which back calculates the real field COF to 0.12. The contractor achieved better results than estimated. Their field-calculated COF data can now be applied to future, similar cable installations to potentially achieve even longer distances.
Good historical data leads to better cable installation planning. This equates to substantial time and cost savings in both design and installation.
Using Polywater’s proven COF data in tension estimation equations, companies can realize real cost savings in underground cable installations. Good data results in better decisions that contribute to a higher overall success rate.
Notifications